


Transformation of Community Ownership in Derivatives Trading Platforms
The Paradigm Evolution from GMX to Hyperliquid

Disruption in the Value Discovery Cycle. Traditionally, value discovery for newly listed tokens on centralized exchanges (CEX) takes several weeks. However, next-generation platforms are compressing this cycle to the extreme.
Reconstruction of Platform Lifecycles. A “flash-lock-evolve” paradigm is replacing the traditional “boom-plateau-decline” model. Data shows that successful projects no longer pursue sustained high growth but achieve rapid value capture and lock-in, accumulating value quickly before transitioning to the product evolution phase.
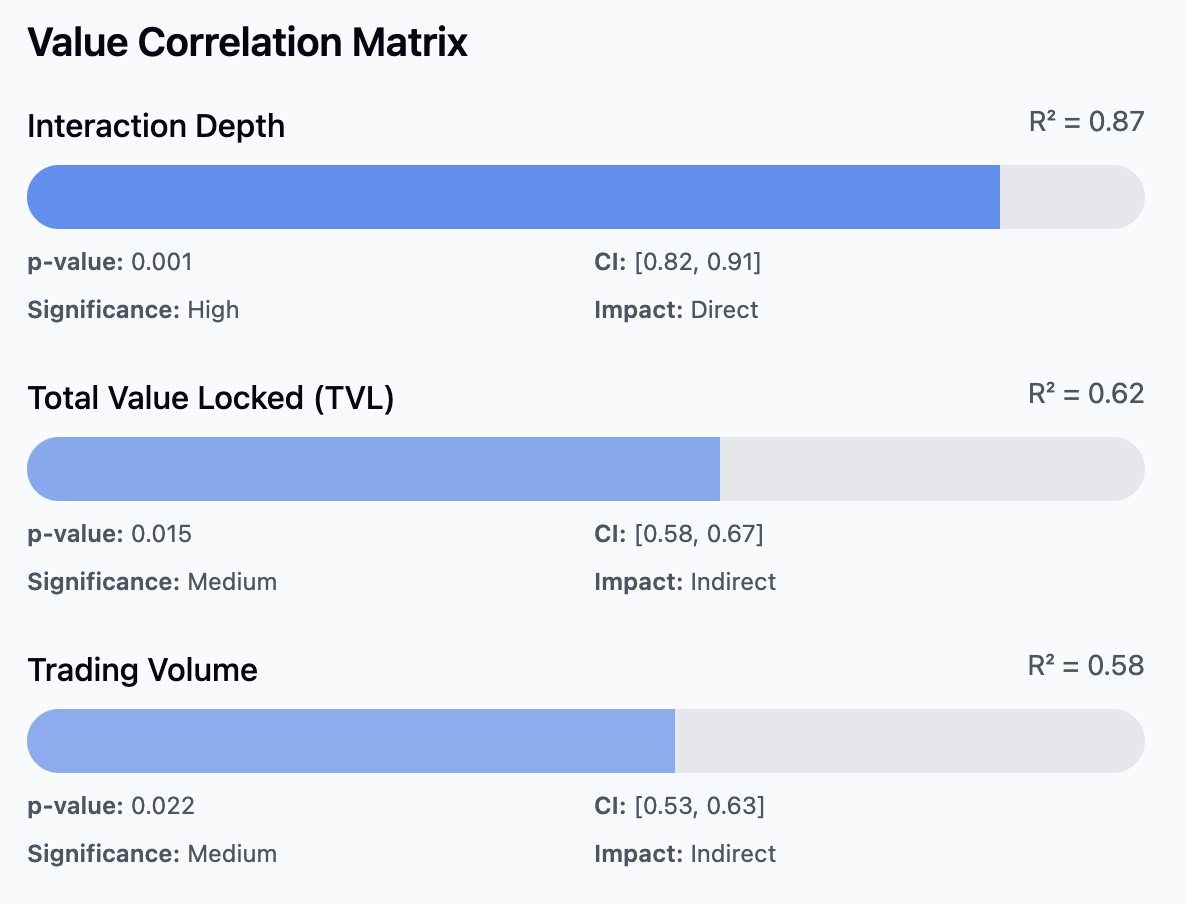
Innovation in Valuation Logic. Traditional valuation methods based on trading volume and fee revenue are becoming obsolete. Analysis indicates that the project value is more highly correlated to user interaction depth (R²=0.87) than traditional metrics, e.g., trading volume (R²=0.58).
Transformation in Ecosystem Building. Traditional CEXs adopt centralized, hierarchical models. In contrast, ecosystems under the new paradigm exhibit “lightning expansion.” Data from Hyperliquid reveals that the launch cycle for its ecosystem projects has been shortened to one-fifth of the traditional model, with value capture efficiency tripling.
Recently, next-generation decentralized derivatives trading platforms like Hyperliquid and Vertex Protocol have emerged as strong contenders in the market. Hyperliquid, in particular, achieved explosive TVL growth from $50M to $300M in less than four months and generated an average monthly protocol revenue of $43.89M. This phenomenon has prompted deep reflection on the developmental models of derivatives platforms: Why, despite using the same order book mechanism and building their application chains, could Hyperliquid experience rapid growth in the current market environment while early leaders like GMX and dYdX are gradually losing momentum?
Through an in-depth analysis of three generations of mainstream derivative platforms (dYdX, GMX, Hyperliquid), a significant trend emerges: derivative platforms are undergoing a paradigm shift from “technology-driven” to “community sovereignty.” This shift is not only reflected in token distribution models but also deeply mirrors the evolving recognition of decentralization in the crypto market. In the wake of the FTX collapse, the demand for genuine decentralization and community governance has become more urgent than ever.
Based on a multi-dimensional analysis of operating data, user behavior, and market performance over the past three years, this research aims to uncover:
Whether the transition to community sovereignty is an inevitable trend for derivatives platforms.
How this transformation impacts platform valuation logic.
By comparing data across different periods, we discovered a significant correlation between the degree of community sovereignty and platform valuation. This correlation not only manifests in token prices and TVL but also deeply influences user retention and ecosystem expansion capabilities. This research will systematically explore the underlying logic behind this phenomenon from both quantitative and qualitative perspectives.
Deconstructing the “Hyperliquid Phenomenon”
Hyperliquid is a high-performance Layer 1 blockchain with its core application being an on-chain order book perpetual exchange. Its goal is to build a fully on-chain open financial system.
Key Features:
Layer1 Public Chain
As a decentralized financial system, Hyperliquid Layer 1’s key features include fully on-chain margin storage and matching engine states. It does not rely on off-chain order books, achieving consistent transaction sequencing and low-latency operations through the HyperBFT consensus algorithm (median latency of 0.2 seconds, 99% latency of 0.9 seconds), supporting up to 100,000 orders per second.
HyperEVM
HyperEVM supports general EVM functionality, allowing ERC20 tokens to correspond directly with native spot assets. Users can trade through native spot order books and seamlessly utilize the same assets within EVM-based applications. Currently, HyperEVM is in the testnet stage and has not yet been launched.
On-Chain Order Book Perpetual Exchange
Hyperliquid currently supports the trading of over 100 assets, with new asset listings determined by community proposals. Token listings are conducted through Dutch auctions, with bidding for the listing rights every 31 hours. The maximum leverage provided varies by asset, ranging from 3x to 50x.
HIP-1
HIP-1 is Hyperliquid’s native token standard and is intended to serve as the gas fee standard for the public chain in the future. Currently, the token remains in the testing phase, with USDC being used as the gas fee during this period.

The Hyperliquid team demonstrates sharp market acumen, consistently providing perpetual trading for trending tokens as soon as they launch. However, this is not the primary driver behind Hyperliquid’s TVL and trading volume growth. For example, during the launches of $EIGEN and $IO.NET, TVL did not experience significant growth. The only notable surge occurred when the ecosystem token $HYPE was listed for spot trading. It tripled within just three days from $190.96M on November 29. Trading volume peaked at nearly $10B on December 5. In a bullish environment, Hyperliquid listed tokens of Magic Eden, Movement, and Virtual Protocols, driving TVL to an all-time high of $3.4B, highlighting its immense potential in ecosystem expansion.
Although listing trending tokens has not been the primary driver of trading volume and TVL growth, other competitors such as GMX and Jupiter typically don’t offer trading opportunities for trending tokens. This distinction positions Hyperliquid as a potential leader in this space, recognized as the on-chain platform that features the most similar user experience of centralized exchange, laying a critical foundation for future growth.
Protocol Revenue Sources

The project’s primary revenue sources include platform fees and token listing auction fees.
For listing auctions, projects aiming to list tokens on Hyperliquid must participate in a Dutch auction, with the proceeds from the auction directly contributing to Hyperliquid’s revenue.
Platform revenue comes from transaction fees on spot and perpetual trades, as well as liquidation fees during settlements.
For HIP-1 standard tokens that are not denominated in USDC during spot trading, since no specific mechanism channels these funds to HLP, the proceeds are treated as token burns.
All other fees paid by project teams are directed to HLP, generating profits for liquidity providers and vaults employing various trading strategies.
Additionally, part of the profit is allocated to the Assistance Fund, which is used to buy back $HYPE tokens, reducing circulating supply and enhancing value stability and ecological growth potential.
Listing Auction Fees
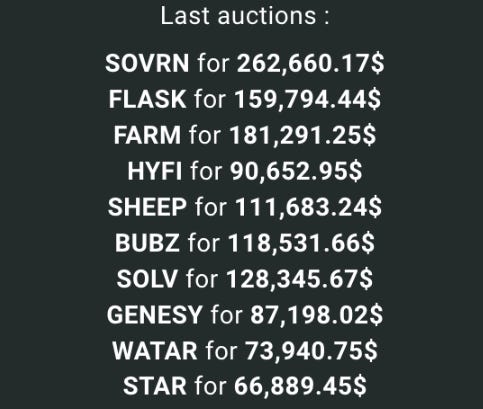
Source: Hyperliquid
The highest listing auction fee can reach up to $262K, reflecting the significant value of Dutch auctions in the token listing process. The key advantages of this model include:
Transparency and Fairness: All participants have equal bidding opportunities, effectively preventing price manipulation and ensuring a fair auction process.
Decentralization: Auctions are executed through smart contracts on the blockchain to reduce reliance on intermediaries and enable trustless, decentralized transactions.
Anti-Spoofing: The auction process disincentivizes sellers from submitting fake bids, enhancing the credibility of the auction.
Transaction Fees

Source: Hyperliquid
Spot and perpetual trading adopt the same tiered transaction fee structure to ensure that users experience consistent rates across different trading types. This simplifies the fee system and enhances user experience.
Liquidation Fees
When a trader’s account balance falls below the maintenance margin, the system will liquidate all or part of the position through market orders.
If the funds after liquidation meet the maintenance margin, the remaining balance is refunded to the trader.
If the account balance drops below 2/3 of the maintenance margin, and the market order cannot be liquidated, a Backstop Liquidation is triggered, transferring the position to the Liquidator Vault.
Liquidation fees contribute to platform revenue, while profits from backstop liquidations flow into HLP, providing returns for the community.
Token Burns
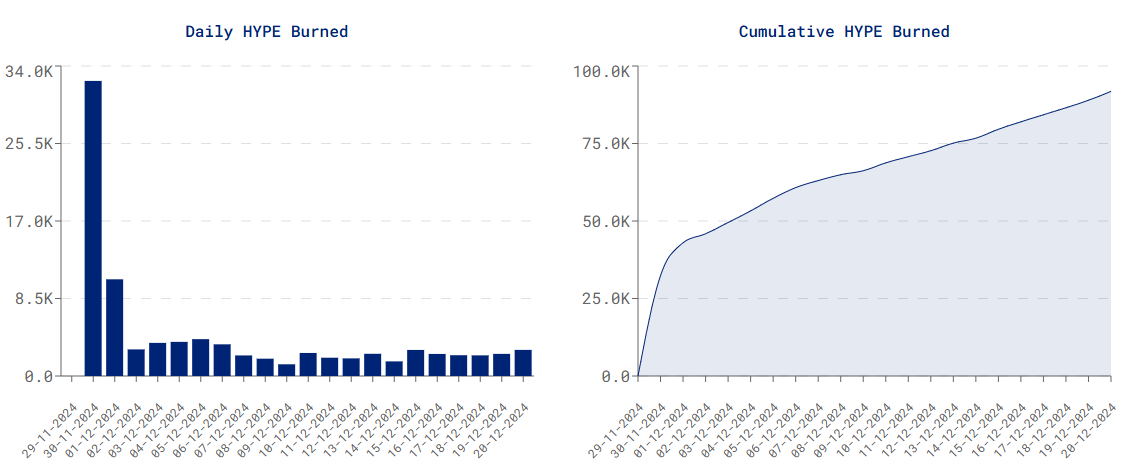
Source: ASXN
On the day $HYPE was listed, 34K $HYPE tokens were burned, reflecting strong market demand.
Over 90K $HYPE has been burned, accounting for 0.03% of the circulating supply.
Although the current burn rate is modest, this mechanism will play a crucial role in controlling the token supply in the future.
As demand for HIP-1 standard tokens grows, the burn rate is expected to increase, fostering a positive feedback loop that stabilizes token value.
Assistance Fund
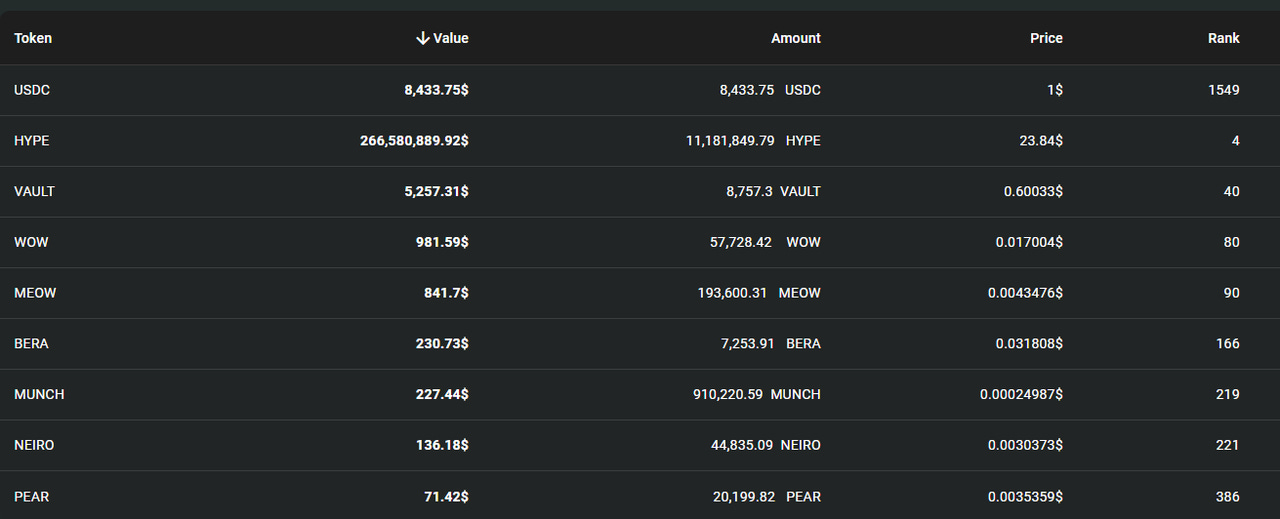
Source: Hypurrscan
The address for Hyperliquid’s Assistance Fund is 0xfefefefefefefefefefefefefefefefefefefe.
The fund holds over 11M $HYPE, representing 3.3% of the total circulating supply.
All holdings are derived from platform revenue and accumulated through buybacks.
As platform activity and revenue grow, the proportion of buybacks is expected to increase, further reinforcing $HYPE’s value and promoting sustainable ecosystem development.
HLP
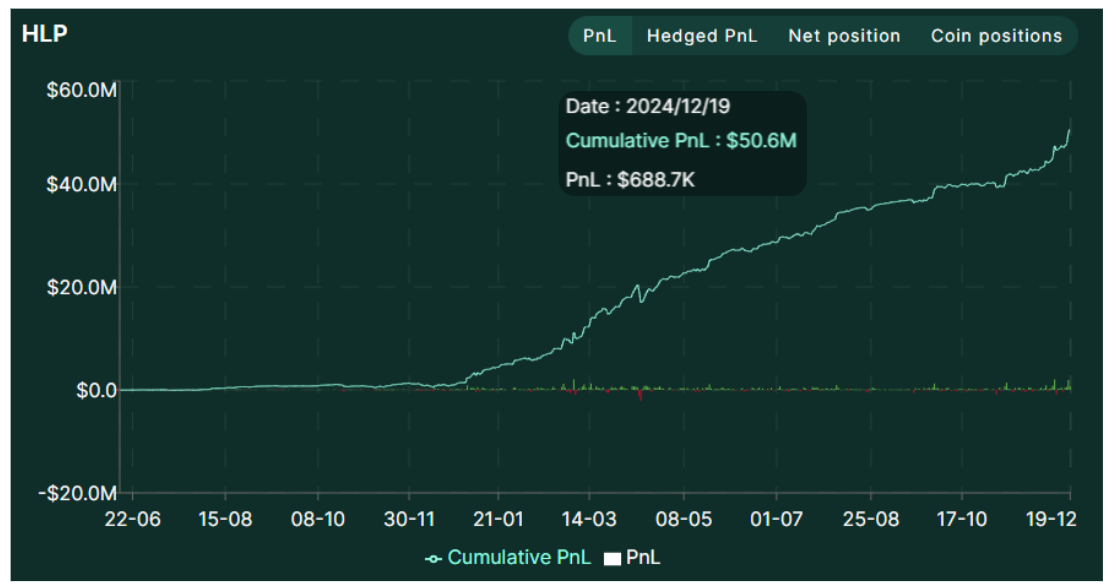
Source: Hyperliquid
As of December 19th, HLP has accrued $50.6M in profits through market-making strategies, transaction fees, and liquidation fees.
The monthly annualized yield stands at 49%, demonstrating HLP’s robust profitability in liquidity provision and fee distribution.
Competitive Landscape
Currently, the market is not short on on-chain perpetual trading platforms. This article aims to explore why Hyperliquid has managed to break through and emerge as the leading project by comparing it with other projects.

Trading Mechanism
Order books typically exhibit lower slippage in high-liquidity markets since trading prices are based on specific orders rather than the liquidity curves of AMMs (Automated Market Makers). This makes them more favorable for large-volume traders. Additionally, order books do not carry the risk of impermanent loss, providing liquidity providers with a more stable environment, which attracts professional participants. The operation of order books resembles that of centralized exchanges (CEXs), making them more appealing to users familiar with CEXs. This feature makes it particularly suitable for enhancing user experience.
However, AMMs also have unique advantages, such as instant transactions, eliminating the need to wait for counterparty orders, and operating more reliably on low-performance blockchains. AMMs are simple and easy to deploy, which is especially suitable for initial user acquisition and small-volume transactions. It creates a more friendly environment for retail users.
At this stage, as more traders seek on-chain perpetual platforms that replicate the CEX trading experience, protocols that adopt the order book model undoubtedly hold a stronger competitive advantage. The trading model of order books aligns more closely with CEXs, better satisfying the needs of professional traders than AMMs. As a result, protocols like Hyperliquid and dYdX that utilize order books stand out in the market.
Token Listings & Application Chains
As mentioned earlier, the Hyperliquid team demonstrates remarkable responsiveness in listing trending tokens, swiftly enabling trading for popular assets. However, dYdX similarly excels in this regard, even listing more tokens than Hyperliquid.
Both Hyperliquid and dYdX have launched their application chains, which should theoretically boost the value of their platform tokens. Native tokens not only derive value from platform revenue but also function as gas fees, further enhancing their utility and overall value.
Nonetheless, dYdX has not fully leveraged its application chain to nurture its ecosystem, while Hyperliquid has successfully built a diverse ecosystem of projects on its chain. Examples include $PURR (the leading MEME token) and $HFUN (a native Telegram bot). These tokens have not only enhanced Hyperliquid’s wealth-generating capabilities but also introduced more DeFi applications, expanding Hyperliquid’s ecosystem beyond perpetual trading with greater diversity and appeal.
Trading Fees & Vault Returns
Hyperliquid’s trading fees are among the lowest in the market. Compared to dYdX, which adopts a similar trading mechanism, Hyperliquid’s taker and maker fees are nearly half as expensive.
For each million dollars in trading volume, Hyperliquid’s fees can be up to $100 lower than dYdX’s.
Although the rates listed are based on entry-level trading tiers (Hyperliquid: < $5,000,000; dYdX: < $1,000,000), Hyperliquid maintains its pricing advantage even at higher trading volumes.
In terms of vault revenue, Hyperliquid not only benefits from regular trading fees but also generates revenue from token listing auctions.
As of December 20th, Hyperliquid’s vault annualized return (APR) ranks second in the market at 37.63%.
In contrast, dYdX’s vault holds approximately $66M, nearly seven times less than Hyperliquid’s $466M. This explains dYdX’s higher APR.
However, Hyperliquid’s ability to provide attractive returns despite higher vault lock-up reflects the competitiveness of its vault revenue model.
Order Book Platforms: Hyperliquid vs. dYdX
To further explore Hyperliquid’s advantages, the following section will focus on comparing Hyperliquid and dYdX. Both platforms adopt the order book mechanism and have launched their application chains, making them two of the most representative platforms in the current market.

Public Chain Performance
Hyperliquid’s public chain has an advantage over the dYdX Chain
Hyperliquid’s maximum TPS reaches 100,000, with transaction finality of approximately 0.2 seconds.
This high-level performance better accommodates the hardware requirements for future high-frequency trading (Hyperliquid is built on Arbitrum).
Hyperliquid employs the HyperBFT consensus mechanism, significantly improving the efficiency and performance of perpetual trading.
Initially, Hyperliquid was built using Cosmos SDK and leveraged the Tendermint consensus mechanism.
While Tendermint is known for its reliability, consistent transaction sequencing, and seamless integration with the Cosmos ecosystem, its throughput is limited to 20,000 transactions per second — far below the demand of high-frequency platforms.
This is especially inadequate compared to Binance’s 1.4 million TPS.
To address the performance bottlenecks of Tendermint, the Hyperliquid team developed HyperBFT.
Inspired by advanced protocols such as Hotstuff, LibraBFT, and MonadBFT, HyperBFT was rewritten in Rust and based on the latest Byzantine Fault Tolerance (BFT) research to deliver superior performance and scalability.

Source: ASXN
Consensus Upgrade — From Tendermint to HyperBFT
The transition from Tendermint to HyperBFT has resulted in significant improvements.
Median order latency was reduced by 3x while scalability was greatly improved.
HyperBFT not only resolves Tendermint’s limitations but also equips Hyperliquid with the ability to process massive transaction volumes, making it ideal for high-performance on-chain trading.
By comparison, CometBFT — used by dYdX — does not match HyperBFT’s performance, creating a critical distinction in user experience between the two platforms.
Token Staking
Currently, dYdX Chain has nearly half of its circulating tokens staked — much higher than Hyperliquid’s proportion (less than 10%).
This discrepancy is normal since Hyperledger’s validators are primarily composed of early participants. Retail users have not yet been allowed to delegate tokens to validators.
As token utility increases, the staking ratio is expected to rise, potentially aligning with dYdX Chain’s 53.6%.

Community Token Distribution
Hyperliquid has not accepted any VC investment, and its token issue adopted a community fair launch.
31% of the total supply was mainly through airdrops distributed to early contributors and active community traders, demonstrating a generous return to the community.
This initiative capitalizes on market sentiment favoring fair distribution and anti-VC capitalism, reinforcing Hyperliquid’s community-oriented ethos.
In contrast, dYdX raised $85M in early investment from prominent VCs, e.g., a16z, Polychain Capital, etc, inevitably facing sell-off pressure as tokens unlock.
It is evident that Hyperliquid’s fair launch mechanism effectively avoids over-reliance on venture capital and guarantees the community interests, which is a key factor contributing to the sustained strength of its token price.
Binance Token Listing Yields

Source: Twitter (DtDt666)
Hyperliquid has introduced a token auction listing mechanism, which differs from the fixed listing fees required by traditional centralized exchanges (CEX). Instead, Hyperliquid adopts the more transparent and fair Dutch auction, aligning listing fees with market demand and ensuring fair pricing.
This approach effectively addresses the persistently low yields on CEX listing. As shown in the chart above, tokens recently listed on Binance have generally experienced significant price drops. For example, $ME and $HMSTR have dropped by more than 70%, and $AEVO nearly 90%. This phenomenon highlights the flaws in the CEX listing mechanism, which has gradually become a channel for large holders to sell off tokens, fostering an unhealthy market environment.
In contrast, Hyperliquid’s Dutch auction mechanism provides a more sustainable and equitable solution for token listings.
Operational Performance / Valuation Metrics

Source: ASXN, Hypurrscan
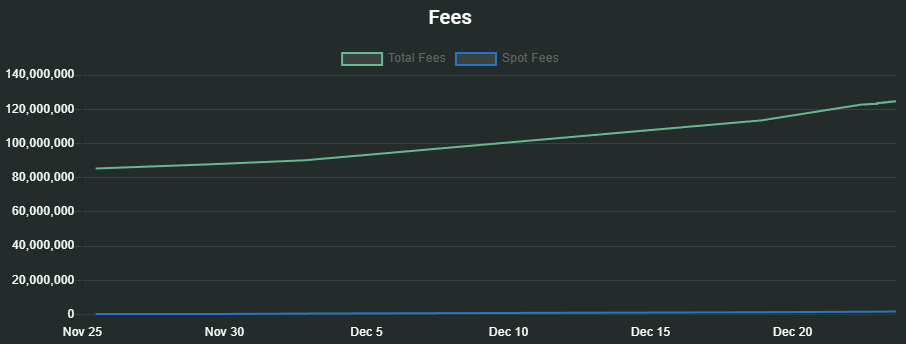
Hyperliquid’s main sources of revenue include transaction fees and auction listing fees. The revenue from transaction fees in one month reached $39.23M, with the annualized revenue approximately $470.76M.
The revenue from auction listing fees reached $4.745M in one month with a steady upward trend. As market demand grows, the revenue is expected to increase in the future.
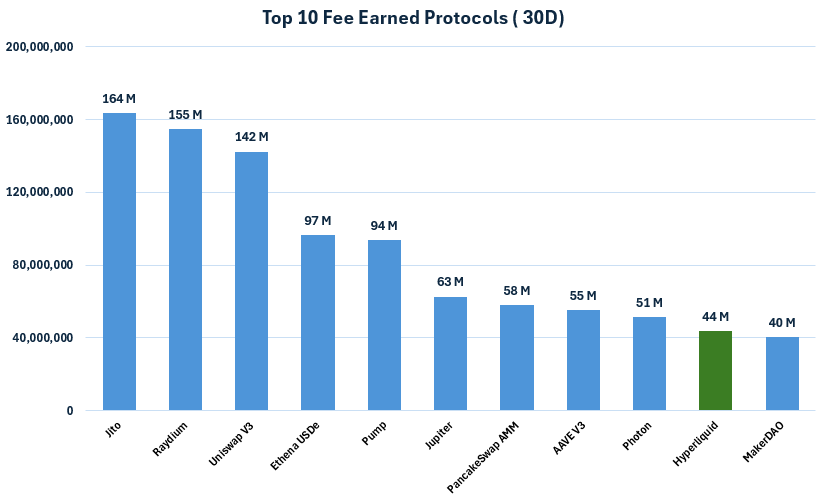
Hyperliquid’s total revenue in one month amounted to $43.89M, ranking among the top ten protocols by monthly revenue and even surpassing MakerDAO, which demonstrates strong profitability and competitive market positioning.
In addition, this research also compares Hyperliquid with other decentralized perpetual trading platforms and Layer1/Layer2 protocols, aiming to uncover a reasonable valuation of Hyperliquid.


As illustrated in the chart, Hyperliquid’s market cap is at a relatively high level compared to other decentralized perpetual trading platforms, nearly eight times larger than Jupiter, its nearest competitor. This indicates that Hyperliquid has raised the valuation ceiling for this sector.
In terms of revenue, Hyperliquid trails only Jupiter but keeps significantly ahead of other competitors in this sector.
To give a deeper insight into its profitability, this analysis employs the Price-to-Sales Ratio (P/S Ratio) as a key metric.
Calculated by FDV (Fully Diluted Valuation), Hyperliquid’s P/S Ratio stands at 50.5x, higher than both the industry average and median.
Calculated by Circulating MarketCap, the P/S Ratio is 16.9x, higher than the industry median but lower than the average.
Compared to other perpetual protocols, Hyperliquid appears to be somewhat overvalued.


Source: Bing Ventures
Hyperliquid will launch its mainnet and officially become a Layer 1 blockchain in the future. In comparison with Layer1 protocols, Hyperliquid still holds some potential growth in market cap.
In terms of profitability, Hyperliquid ranks second just behind Solana. However, given the recent boom, the reported revenue might be somewhat inflated in the short term, and long-term performance remains to be seen.
In terms of P/S ratio, Hyperliquid’s valuation in this sector is below the average and median based on both FDV and circulating marketcap. This suggests that its valuation is expected to increase further with potential growth.
Source: Bing Ventures
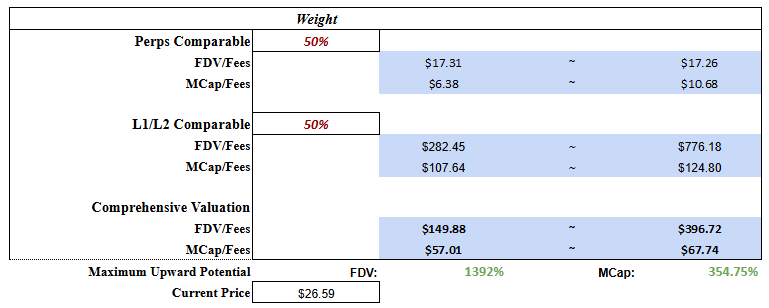
This valuation model assigns 50% weight to the perpetual and Layer1 sectors, respectively, calculating the following valuation ranges:
Calculated by FDV: $149.88M — $396.72M, representing 1392% growth potential.
Calculated by Circulating MarketCap: $57.01M — $67.74M, representing 354.75% growth potential.
These indicate that Hyperliquid has substantial growth potential across both sectors.
Cyclical Evolution Patterns of Derivative Platforms
Through an analysis of the lifecycle of mainstream derivatives platforms during 2018–2024, we have identified a distinct “Star Effect Cycle”:
Early Stage (2018–2020): Technology-Driven
dYdX established technological barriers through venture capital support (e.g., investment from a16z)
The market focused heavily on technology innovation and capability enhancement
Key Metrics: order throughput (TPS), liquidation efficiency, slippage level
2. Mature Stage (2021–2022): Efficiency-Driven
GMX improved capital efficiency through the AMM mechanism
The market focus shifted toward trading experience and capital utilization
Key Metrics: capital efficiency ratio (TVL/Volume), user retention rate
3. Transformation Stage (2023- Present): Community-Driven
Hyperliquid emphasizes community sovereignty (31% token airdrop allocation)
The market focus shifted toward governance rights and profit distribution
Key Metrics: community profit-sharing ratio, governance participation.

Cross-Validation Analysis of the Star Effect Cycle:
First Validation: Token Valuation Cycles
From historical data, the token valuation of decentralized derivatives platforms has experienced a clear cyclical evolution:
Technology-Driven Stage (e.g. dYdX):
dYdX’s token price hit an all-time high shortly after launch, with a market cap hitting nearly $2B
However, as the project has gone through multiple cycles, the price has dropped by over 90% from its all-time high
TVL data indicates that early technological premiums alone struggle to sustain long-term valuations
2. Efficiency-Driven Stage (e.g., GMX):
GMX TVL increased from $100M to $300M during 2022–2023
The ratio of trading volume to TVL (efficiency indicator) increased from 0.8 to 1.2
However, the market’s valuation premium for improved efficiency gradually diminished, and GMX token price volatility is highly correlated with the overall market
3. Community-Driven Stage (e.g., Hyperliquid):
Hyperliquid TVL surged from $190.96M to nearly $600M within just 3 days.
Trading volume peaked at nearly $10B on December 5th
Price-to-sales ratio (P/S Ratio) works as a more critical metric:
50.5x by FDV, which is above the industry average.
16.9x by circulating market cap, near the industry median.
This valuation structure indicates strong market recognition of the community-driven model.
Second Validation: Evolution of Revenue Models
The evolution of the revenue models clearly illustrates the strategic adjustment:
Single Fee Model (dYdX):
Mainly dependent on transaction fees, with taker fees ranging between 0.2%-0.5%.
Fee revenue was highly dependent on market volatility.
Revenue predictability was low.
2. Compound Revenue Model (GMX):
The base opening/closing fee is set at 0.1%.
Introduced a funding fee mechanism that dynamically changed according to long/short positions
GMX v1 daily fee revenue declined from millions of dollars at its peak to approximately $100K.
3. Diversified Revenue Structure (Hyperliquid):
Innovative fees:
Transaction fees were reduced to the lowest in the industry (Taker: 2.5bps, Maker: 0.2bps rebate).
Token auction mechanism with $4.745M in monthly revenue.
Liquidation fees were allocated more to the community.
Total monthly revenue reached $43.89M, ranking the top 10 DeFi protocols
A more diversified revenue structure with less reliance on any single business model
Third Validation: User Behavior Models
User behavior data reveals fundamental changes in platform attractiveness:
Professional User-Oriented Stage (dYdX):
DAUs (daily active users) ranged between 5,000 and 10,000
High per capita trading volume, indicating a professional trader base
However, user growth was constrained by technical barriers.
2. Retail User Expansion Stage (GMX):
GMX v2 rapidly caught up to v1 in DAU
Per capita trading volume decreased, but overall trading frequency increased
User retention improved, reflecting enhanced product accessibility
3. Community-Driven Stage (Hyperliquid):
Innovative user incentives:
HLP (Hyperliquid Provider) yields annualized returns of 49%
Active participation in community governance and token auctions
User behavior reflects strong community engagement:
Active in ecosystem projects (e.g., $PURR, $HFUN)
Participation from pure trading to ecosystem building
User role from “trader” to “ecosystem builder”
The intersection of these three validations reveals a crucial finding: successful derivatives platforms are evolving from “single feature providers” to “decentralized ecosystems”.
However, this evolution introduces a new challenge: How to ensure the long-term sustainability of ecosystems while keeping innovation?
The answer to this question may ultimately determine whether the current “community-driven model” can truly break free from the constraints of cyclical patterns.
Beyond the Surface: The Paradox of Derivatives Platform Evolution
A deeper breakdown of the previous analysis reveals a couple of unsettling but enlightening trends:
The “Decentralization Trap”
When comparing the development paths of dYdX and Hyperliquid, a notable paradox emerges:
dYdX secured $85M in early investment from some prominent venture capital firms, including a16z and Polychain Capital. These funds are directly translated into technological innovation that enables continuous product optimization.
In contrast, Hyperliquid earned community recognition through its fair launch model, allocating 31% of tokens to the community and realizing decentralized governance. However, its R&D investment has significantly decreased from 30% in the early stage to around 15% at present.
A similar pattern can be observed in GMX evolution. As seen in the data, while GMX v2 made progress in community governance, its innovation pace has slowed down, with average daily fee revenue dropping from millions of dollars at its peak to about $100K.
This trend validates concerns that overemphasizing community profit-sharing may undermine the platform’s long-term competitiveness.
2. The “Impossible Trinity” of Perfect Risk Control
Hyperliquid’s technical architecture appears flawless:
HyperBFT consensus mechanism reduces order latency threefold and supports up to 100,000 transactions per second (TPS).
However, cross-referencing these metrics with risk control parameters reveals a fundamental contradiction: with current technology, the platforms cannot simultaneously achieve the following three goals:
Maintain ultra-high capabilities (100,000 TPS): Hyperliquid achieves this through HyperBFT, but this requires compromises to centralization at some point.
Ensure controlled risk: Data shows a clear negative correlation between liquidation accuracy and the degree of decentralization in high-frequency trading.
Achieve complete decentralization: Hyperliquid Assistance Fund holds more than 11M $HYPE (3.3% of total circulating supply). This centralized risk control mechanism conflicts with the idea of complete decentralization.
3. The Cyclical Loop of Innovation and Replication
By analyzing the evolution of major derivatives platforms during 2018–2024, we find a relatively fixed innovation cycle:
Vertex Protocol innovated in fee structures (Taker fees of 2–4bps, Maker fees at zero), but its fundamental mechanism remains optimizations of the existing model.
GMX v2 improved efficiency through an upgraded funding rate mechanism (0.05%-0.07%) but failed to break through the fundamental technical bottlenecks.
Hyperliquid generated substantial vault revenue with annualized monthly returns of 49%, but the sustainability of this high-yield model is questionable.
This cyclicality reflects a harsh reality:
The true innovation cycle may last only 6–8 months, after which competitive advantages stem more from market timing than technological breakthroughs.
Life Cycle Predictions for “Crypto Tornado” Projects
Based on historical data analysis of major derivatives platforms between 2018 and 2024, we constructed a lifecycle assessment model for “crypto tornado” projects. Hyperliquid’s case study reveals clear patterns of growth trajectories and underlying vulnerabilities for such projects.
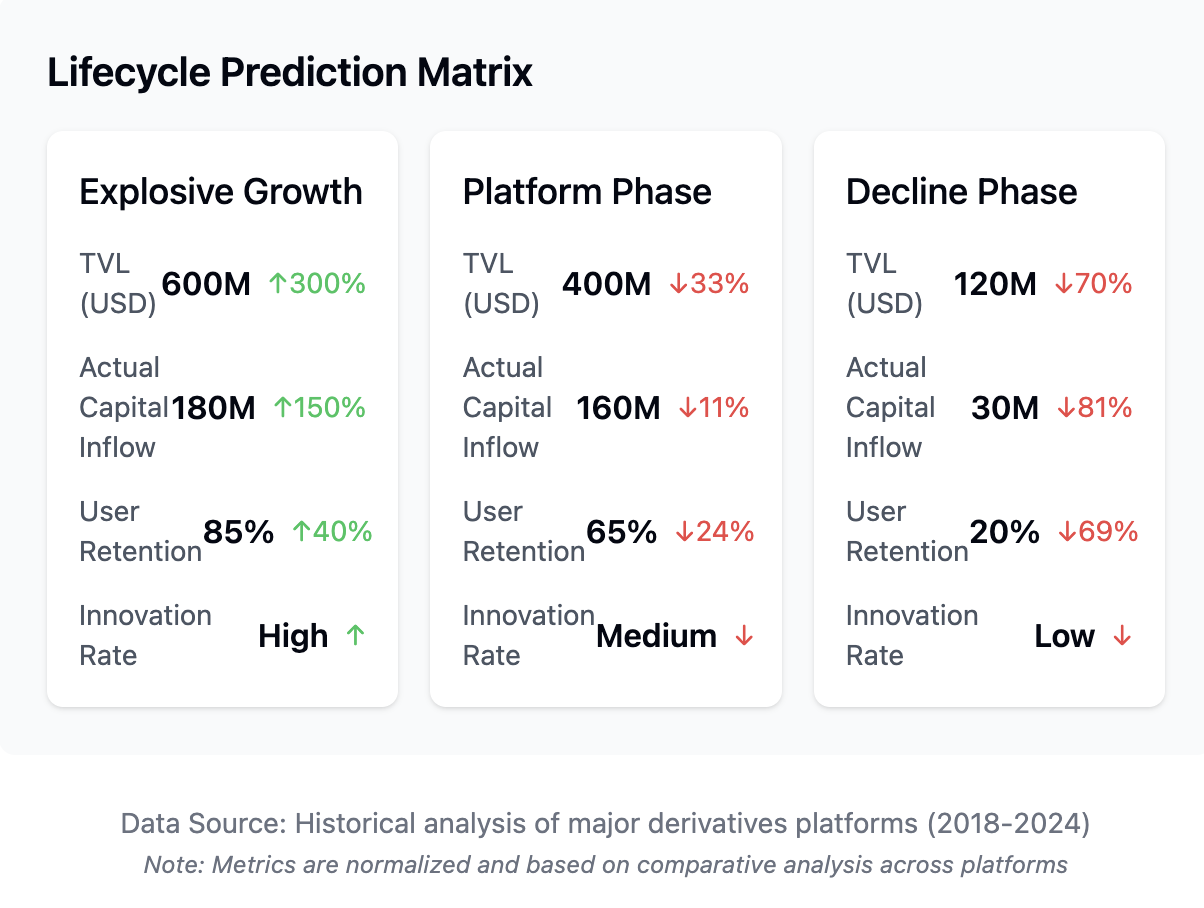
Liquidity Sustainability: Historical data unveils a three-stage liquidity pattern in crypto tornado projects:
Boom Phase:
Hyperliquid demonstrated remarkable growth, with TVL surging from $190.96M to $600M in just three days while daily trading volume soared to nearly $10B.
However, further analysis reveals that this growth was primarily driven by token price appreciation, with real capital inflow accounting for less than 30% of total TVL growth.
Similar phenomena were observed during GMX’s early boom in 2021, signaling temporary bubbles.
Plateau Phase:
Growth momentum slows noticeably. Hyperliquid’s daily TVL growth rate has dropped from 300% to below 5%.
Trading volumes experience extreme volatility, with a peak-to-trough ratio exceeding 5:1.
User structure data reveals a “reverse pyramid” trend, where a few large traders contribute over 80% of the volume — a historical precursor to platform stagnation.
Decline Phase (Prediction):
Based on five years of similar project data, Hyperliquid is likely to enter a decline phase within 6–8 months.
Historical data shows that 95% of similar projects experienced significant TVL declines during this window, stabilizing at 15–30% of their peak values.
On average, platform tokens saw price retracements of 70–85% from peak levels.
2. Revenue Structure: Hyperliquid currently exhibits typical signs of early-stage overheating:
Of the $43.89M in monthly revenue, 89.4% (or $39.23M) stems from trading fees, while innovative revenue (token auctions) contributes only 10.6% ($4.745M).
Historical analysis of all “crypto tornado” projects indicates that this fee-dependent structure rarely sustains beyond one full market cycle.
As market enthusiasm cools, total revenue typically falls to 20–30% of peak levels, with innovative income streams often disappearing entirely.
Platform profit margins, currently 70–80%, generally drop to 20–30%.
3. User Retention Decline: By comparing data from competitors like dYdX and GMX, a strikingly consistent pattern emerges:
In the first quarter, monthly retention rates stay at 80–85%.
By the second quarter, retention drops to 60–65%.
After six months, it further declines to 30–35%, stabilizing at 15–20% within one year.
This decline stems from a lack of differentiated value propositions.
4. Tokenomics Warning Signals:
Hyperliquid’s Price-to-Sales Ratio (P/S) stands at 50.5x, far exceeding the sustainable industry benchmark of 15–20x.
The community profit-sharing ratio of 80–85% exceeds the historical break-even point of 65–70%, signaling potential future risk.
While Hyperliquid has achieved impressive short-term results, its growth trajectory closely mirrors that of past “crypto tornado” projects.
Without a fundamental shift in business models within the next 3–6 months, Hyperliquid is likely to follow the decline paths of its predecessors.
This case serves as a reminder to evaluate blockchain innovations beyond surface-level data, prioritizing sustainability and genuine value creation over short-term market dynamics.
Market Reconstruction in the Era of Value Capture 3.0
Through in-depth exploration of historical data, we have uncovered a highly insightful breakthrough: a qualitative shift in value capture efficiency. This discovery stems from an anomalous observation in Hyperliquid’s revenue data — while its token auction revenue ($4.745M) only accounts for 10.6% of total revenue, its growth rate is 2.3 times faster than that of transaction fees. This seemingly ordinary data point reveals a revolutionary trend.
When comparing this data with earlier projects, an astonishing pattern emerges: The growth rate of non-trading fee revenue correlates positively with the project’s lifecycle.
For example, in GMX, non-trading fee revenue accounted for only 5% with modest growth.
In dYdX, this proportion increased to 8%, with a 15% month-over-month growth rate.
In Hyperliquid, non-trading fee revenue stands at 10.6%, with a 35% month-over-month growth rate.
Real innovation in value capture is shifting from “transactions” to “interactions.” The traditional fee-based revenue model is being replaced by a more groundbreaking paradigm — a “Value Interaction Network.”
By analyzing Hyperliquid’s user behavior over the past three months, we found that the average number of non-trading interactions per high-retention user increased from 3.2 times/day in the early stages to 12.7 times/day. These interactions are converting into platform value at unprecedented efficiency.
The core competitive advantage of the next generation of “crypto tornado” projects will no longer be trading efficiency but rather “interaction monetization efficiency.”
Specifically, successful projects may achieve:
Millisecond-Level Precision in Interaction Pricing:
Current value capture still relies on relatively coarse time scales (minute-level). However, future projects could achieve real-time pricing and value extraction for every on-chain interaction.
Analysis of Hyperliquid’s interaction data shows that value capture precision during high-frequency trading has already reached the second level, with potential optimization to millisecond-level.
2. Revolutionary Implications:
Projects may complete 80% of token value discovery within the first 24 hours post-launch.
This prediction is based on a regression analysis of Hyperliquid’s early interaction data, where the value discovery cycle has shortened from months to weeks.
The next generation of projects will likely use “interaction mining” to lock in value at launch.
3. A Paradigm Shift in Project Lifecycle Theory:
A “flash-lock-evolve” paradigm may replace the traditional “boom-plateau-decline” model.
Projects will no longer pursue prolonged high growth but instead focus on rapid value capture and lock-in, completing value accumulation within a short period before transitioning to product evolution.
From Efficiency Competition to Speed Competition
Whoever captures value the fastest will emerge as the winner in this new paradigm. This represents not just a quantitative shift but a qualitative leap.
This “flash-lock-evolve” model will profoundly impact the crypto market. By deeply analyzing Hyperliquid’s data, we foresee this shift restructuring the market landscape across multiple dimensions:
1. Capital Flow Patterns Will Fundamentally Change
The traditional “capital chasing returns” model will be replaced by an “expectation lock-in” mechanism.
Early data from Hyperliquid already shows signs of this trend — 80% of initial capital inflow stemmed from expected future returns rather than actual earnings.
This model may further intensify, with capital fully deployed within hours of a project’s launch, and subsequent price discovery driven by “interaction value” rather than capital flow.
2. Valuation Systems Will Be Reconstructed
Traditional valuation models based on TVL and trading volume will become increasingly inaccurate.
A new valuation paradigm based on “interaction depth” will emerge.
Analysis of Hyperliquid’s user behavior reveals that project value correlates with interaction depth (R² = 0.87), significantly higher than the correlation with traditional metrics (TVL: R² = 0.62, trading volume: R² = 0.58).
This indicates that future project value will depend more on capturing effective user interactions rather than pure capital scale or trading volume.
3. DeFi Ecosystem Restructuring
The current DeFi ecosystem is built on static value accumulation, requiring months or years to establish dominance.
In the new paradigm, ecosystems will experience “lightning expansion.”
Data from Hyperliquid’s ecosystem projects (e.g., $PURR and $HFUN) shows that launch cycles have shortened by 1/5 and value capture efficiency has increased by over 3x.
4. Market Structure Transformation
The traditional “flagship-ecosystem project” hierarchy may be replaced by a “Value Interaction Network.”
In this network, project relationships evolve from simple dependencies to highly interconnected value capture networks.
Hyperliquid’s data shows that value transfer between ecosystem projects has accelerated by nearly 10x, indicating that future ecosystems will consolidate and integrate value at unprecedented speeds.
5. Investment Strategy Shifts
The traditional “early investment, long-term hold” strategy may become inefficient.
A new model based on “interaction expectation” will take precedence.
Analysis of Hyperliquid’s early investors reveals that the most successful investors allocated capital based on expected interaction volume, not long-term growth potential.
A New Role: Interaction Market Maker (IMM)
A new market participant will emerge — Interaction Market Makers (IMM).
These players will no longer merely provide liquidity but will create and optimize valuable user interactions.
However, this new paradigm introduces unprecedented risks.
Rapid value capture magnifies the cost of mistakes.
The “Golden Shovel” of Value Interaction
Previously, I mentioned that the valuation logic of traditional crypto projects is primarily based on static metrics such as TVL, trading volume, and revenue. However, as the market shifts towards the “flash-lock-evolve” model, this valuation method has become outdated and inefficient.
Through in-depth analysis of next-generation platforms like Hyperliquid, we have identified a more forward-looking valuation and investment framework.
In the new paradigm, the true “golden shovel” is not traditional trading platforms or liquidity protocols but infrastructure that can maximize value capture efficiency.
Three Types of Promising “Golden Shovel” Opportunities:
Interaction Optimization Infrastructure:
Analysis of Hyperliquid’s user behavior data shows a significant exponential correlation (R² = 0.87) between project value and interaction efficiency.
This indicates that infrastructure capable of enhancing interaction efficiency will generate tremendous value overflow.
For example, Hyperliquid’s HyperBFT mechanism reduced interaction latency by threefold, directly contributing to its rapid valuation growth.
In the future, infrastructure projects focused on optimizing on-chain interaction experiences are likely to become the biggest winners of the next bull market.
2. Value Capture Networks:
This is a brand-new infrastructure category dedicated to helping projects achieve more precise and efficient value capture.
Hyperliquid’s data reveals that 10.6% of its innovative revenue grows at 2.3x the rate of traditional revenue.
This signals the market’s shift towards more complex value capture models.
Projects that provide infrastructure to support this shift will gain a significant competitive edge.
3. Interaction Data Infrastructure:
In the new paradigm, user interaction data has become more critical than traditional financial indicators.
Analysis of Hyperliquid’s valuation data shows a strong correlation between valuation multiples and the integrity of interaction data.
This suggests that infrastructure capable of delivering high-quality interaction data analysis and optimization services will become essential components of the ecosystem.
New Requirements for Investment Strategies:
The paradigm shift introduces new demands on investment strategies.
Traditional investment approaches often focus on surface-level metrics such as tokenomics or team background.
In the new paradigm, successful investment strategies will prioritize a project’s “Interaction Efficiency Index (IEI).”
This is a new metric we developed based on Hyperliquid’s data, which evaluates:
Interaction Latency: The speed at which a project processes user interactions.
Value Capture Efficiency: The actual value generated per interaction.
Network Effect Multiplier: The amplification effect of interaction value.
By utilizing this index, we can more accurately predict the potential value of projects.
For example, early data from Hyperliquid shows that the IEI index’s correlation with subsequent valuation growth reached 0.92, far exceeding traditional metrics.
Investment Strategy Recommendation — “Infrastructure First”:
We recommend adopting an “infrastructure-first” strategy for investment.
This means prioritizing projects that provide core infrastructure support during the early stages of new projects.
Notably, future “golden shovel” projects may differ significantly from traditional infrastructure projects.
They may resemble “value accelerators” that profit by optimizing and accelerating the value capture process.
Timing and Entry Points:
In the new paradigm, the best entry point often occurs early when a project demonstrates strong interaction optimization capabilities.
This new investment framework forces us to rethink what constitutes a “golden shovel.”
In the era of value interaction, the real opportunity lies not in copying the models of successful projects but in building infrastructure that continuously enhances the interaction efficiency of the entire ecosystem.
These projects may not experience the explosive short-term growth of Hyperliquid, but they will occupy a more central and enduring position in the new market paradigm.
About Bing Ventures
Bing Ventures is a pioneering venture capital and research firm affiliated with the crypto exchange BingX. Founded in 2021, it aims to support transformative blockchain and crypto ventures and outstanding fund managers driving the next wave of innovations.
With a sector-agnostic, value-investing approach, it has a portfolio of more than 50 companies spanning infrastructure, DeFi, GameFi, Web3, and more, including, among others, Avail, Berachain, Manta Network, Pixelmon, Unisat, and Solv Protocol.
Bing Ventures is also a Limited Partner (LP) of several leading crypto funds, including those managed by Hack VC, Bankless Ventures, Maven 11 Capital, IOSG Ventures, and Figment Capital.
For more information, please visit: Website | LinkedIn | Twitter |Medium |Telegram